Mastering the Technique of Reading Gold Charts
The year was 2011. Gold charts showed a classic “double top” pattern that few noticed. Within months, the precious metal plunged from its all-time high of $1,921 to $1,533 per ounce. We’ve learned that reading gold charts is vital. Charts often whisper before prices shout, and today, we’re excited to share these whispers with you.
Note: While we’re passionate researchers sharing our knowledge, we’re not financial advisors. Always consult with qualified professionals before making investment decisions.
The Modern Gold Market Context
Current Market Dynamics (2024)
We’re witnessing unprecedented times in the gold market! Let’s get to the bottom of this. If you would imagine New Your City, The Jewelry District AKA The Dimond District. There is a hustlers feeling in the air. Price hagling and numbers as you pass by each store front. Everyone is talking about the price of gold.
- Inflation’s Impact
When prices rise, people turn to gold as a value-preserving asset, driving up its price through increased demand. To protect their savings from inflation, many investors turn to options like physical gold or Gold ETFs to diversify their portfolios. - Global Uncertainty
During political tensions or conflicts, investors seek gold’s stability as a safe haven, pushing prices higher. - Central Bank Influence
Banks’ decisions on interest rates and money supply affect gold prices. Lower rates often boost gold investment, and banks themselves buy gold. - Digital Trading
Online platforms make gold trading accessible to everyone, bringing new investors and affecting market prices.
Why Reading Gold Charts Reading Matters More Than Ever
In today’s volatile environment, understanding gold charts isn’t optional – it’s essential. As renowned trader Paul Tudor Jones quotes, “The price pattern is the most reliable signal for future direction.”
Mastering Chart Types: When to Use Each
Line Charts: The Strategic Overview
Best Used For:
- Getting a clean view of primary trends
- Long-term investment decisions
- Identifying key support and resistance levels
- Removing noise from daily fluctuations
When to Avoid:
- Day trading decisions
- Volatility analysis
- Entry/exit point precision
Please note that the charts are for educational purposes only!
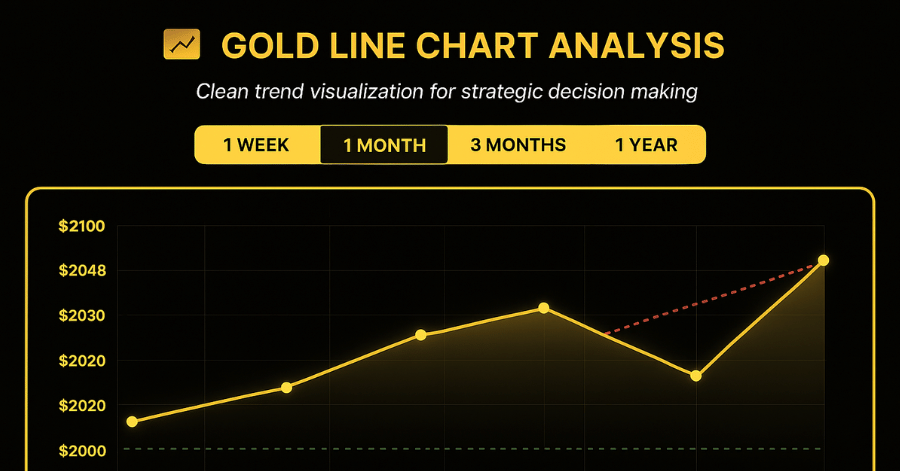
Click Here: To Try Our Gold Chart Line Analysis
Candlestick Charts: The Tactical Navigator
Best Used For:
- Day trading and swing trading
- Pattern recognition
- Psychological price levels
- Momentum analysis
Key Patterns We Watch:
- Doji (indecision)
- Hammer (potential reversal)
- Engulfing patterns (trend changes)
- Morning/Evening stars (reversal signals)
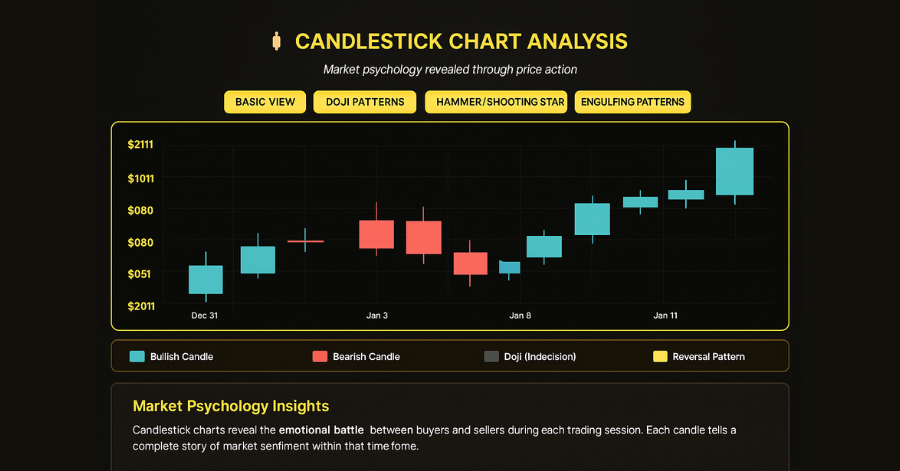
Click Here: To try our Gold Candlestick Chart
Bar Charts: The Professional’s Choice
Best Used For:
- Institutional trading
- Volume analysis integration
- Price range assessment
- Multiple time frame analysis
For those looking to dive deeper into reading gold charts, Investopedia offers a comprehensive, free guide on technical analysis and chart reading basics, including candlestick and line charts commonly used in gold trading. Additionally, TradingView provides free charting tools and a community-driven library of tutorials on interpreting gold market trends. Both sources are reputable and ideal for gaining foundational knowledge in understanding price patterns and technical indicators.
Advanced Technical Indicators
Moving Averages: Reading Gold Charts & Finding the Trend
Moving averages
- Moving averages (MAs) It’s like a “big picture” guide to price trends.
They smooth out the ups and downs, showing whether prices are generally going up, down, or staying level.
Key terms to know:
Golden Cross
2. Golden Cross: When a 50-day average line crosses above the 200-day line, which often means prices could go up.
Death Cross: When the 50-day line crosses below the 200-day, it could signal a price drop.
MACD: Momentum’s Movement
MACD
3. Helps spot shifts in price momentum, showing if prices might rise or fall soon.
It’s used to find points where the price may change direction, helping traders decide when to buy or sell.
The main things to watch:
Signal Line Crossover
4. Signal Line Crossover: When MACD crosses its signal line, it could indicate a change in momentum.
Histogram: Shows how strong the momentum is and if it might be changing direction.
Bollinger Bands: The Price Range
Bollinger Bands
5. Bollinger Bands are like guardrails, showing a range where the price tends to move.
They help traders see when prices get too high or too low compared to recent movement.
Volatility
6. Volatility: If bands widen, prices are moving more; if they narrow, prices are calmer.
Reversal Points: When prices touch the top or bottom band, it may hint at a possible price reversal.
RSI: Measuring Strength
The Relative Strength Index (RSI)
7. The Relative Strength Index (RSI) checks if a price is moving too fast, helping find overbought or oversold conditions.
50-Centerline
8. 50-Centerline: RSI crossing above 50 can mean strength, while crossing below could mean weakness.
Hidden Divergences: These happen when price and RSI disagree, sometimes hinting at a hidden trend.
Each of these tools helps tell a different part of the story, showing price strength, momentum, and potential changes.
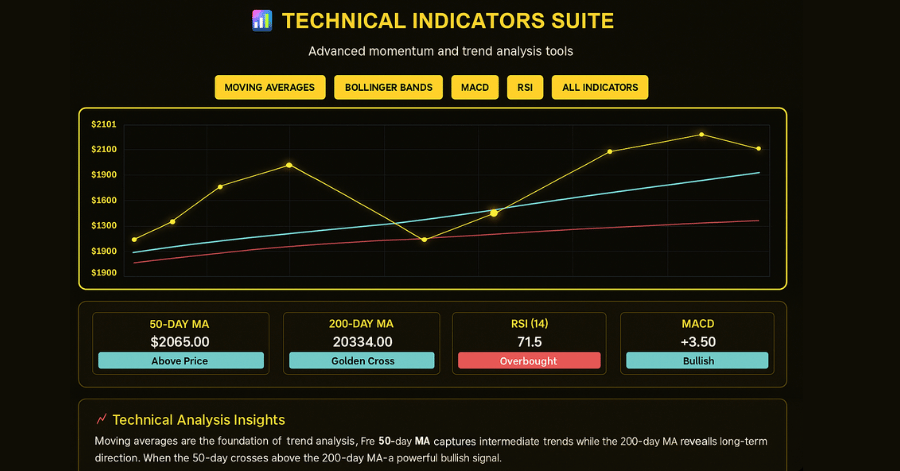
Click Here To Try Our Gold Technical Indicators Tool
Volume Analysis: The Market’s Truth Serum
Volume Patterns We Monitor While Reading Gold Charts
- Rising Price, Rising Volume
When both price and volume go up, it usually means there’s strong interest from buyers. This pattern shows that the trend is likely real and could continue. You’ll often see this during accumulation, where investors are building up their positions. - Rising Price, Falling Volume
If the price rises but the volume drops, it may signal that interest is weakening. Fewer buyers are jumping in, which can mean the trend might be running out of steam—a possible red flag for those hoping the trend will last. - Falling Price, Rising Volume
When prices are dropping and volume is high, it’s often a sign that investors are selling in large numbers. This pattern can signal a distribution phase, where people are exiting their positions, and it often happens before big drops or “market tops.”
Historical Volume Events and Their Impacts
Volume tells the “story behind the numbers,” showing how much interest there is in a price move and whether it might continue.
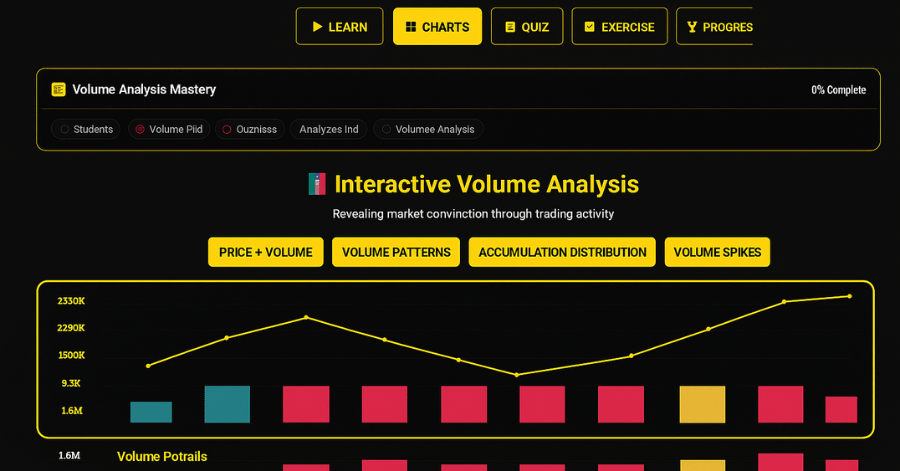
Click Here To Try Our Gold Volume Analysis Tool
Short-Term Trading Patterns and Tools
Intraday Patterns
- Opening Range Breakouts
- First hour trading range
- Volume confirmation essential
- Stop placement strategies
- Mid-Day Reversals
- Common at 10:30 AM EST
- Volume requirement higher
- Risk management crucial
Time-Based Analysis
- Asian session characteristics
- London/New York overlap opportunities
- End-of-day trading strategies
Chart Pattern Psychology
Understanding Market Psychology Through Reading Gold Charts
- Accumulation Patterns
Accumulation patterns happen when smart investors, like big financial institutions, start buying up a lot of gold or stocks quietly. They’re trying to get a good position without causing the price to jump too much. These patterns create a base or foundation on the chart, where the price moves within a range. The mentioned patterns appeal to investors looking to strengthen their gold portfolio allocation.- Base Building: The price stays in a range, moving up and down within certain limits.
- Institutional Buying Signs: Large investors buy without pushing the price up too fast, so they can build a position.
- Volume Characteristics: Volume often increases slightly as these investors buy in.
- Distribution Patterns
Distribution patterns are the opposite. This is where big investors start selling, or “distributing,” their positions. The price may appear to level off or hit a top, as the big players sell their assets to retail traders or smaller investors. Distribution can hint at key movements, affecting all types of investments from physical gold to gold mining stocks.- Top Formation Process: Prices stabilize or start to form a peak before possibly dropping.
- Smart Money Exit Signals: Large investors start selling off their shares without crashing the price, passing them to smaller buyers.
- Volume Confirmation: Volume spikes often confirm that selling activity is taking place.
Understanding these patterns helps us see what big investors (often called “smart money”) are doing and what their actions might mean for the market’s future moves.
Real-World Application: A Complete Analysis Framework
Step-by-Step Analysis Process
- Top-Down Analysis
- Monthly chart trend direction
- Weekly chart support/resistance
- Daily chart entry points
- Pattern Confirmation
- Multiple time frame alignment
- Volume validation
- Indicator confluence
- Risk Management Integration
- Position sizing based on volatility
- Stop-loss placement strategies
- Profit target calculation
Recent Market Example: Gold in 2025
See it here in action
Case Study: Gold's Explosive Start to 2025 Gold Movement
Let's walk through the real-world events and market drivers that defined gold's historic movement in the first quarter of 2025.
The Setup (January - February 2025)
- Following a strong 2024, gold began Q1 2025 in a powerful position, starting the year near $2,650 per ounce.
- Key market drivers included heightened geopolitical uncertainty from ongoing global conflicts and the potential economic impacts of new U.S. trade tariffs.
- The quarter saw a massive resurgence in investor demand, with inflows into gold-backed ETFs skyrocketing by over 1,100% compared to the previous quarter.
What We Saw: The Market Drivers
- A Record-Setting Price Surge
- Gold experienced a dramatic upward trajectory throughout the quarter, quickly surpassing the $2,800 mark in February.
- The rally accelerated into March, decisively breaking the key psychological barrier of $3,000 per ounce and setting new all-time highs above $3,150.
- Powerful Fundamental Forces
- Explosive ETF Inflows: Q1 2025 saw the highest level of investment into gold ETFs in three years, totaling over 226 tonnes. This signaled a major return of retail and institutional investors to the gold market.
- Robust Central Bank Buying: While slightly lower than the record pace of 2024, central banks continued to be major buyers, acquiring a net total of 244 tonnes of gold. This provided a strong institutional demand floor under the market.
- Safe-Haven Demand: Escalating trade-related tensions and persistent geopolitical conflicts in the Middle East and Eastern Europe drove significant demand for gold as a proven safe-haven asset.
The Outcome & Key Takeaways
Analyzing the events of Q1 2025 provided several key insights:
- A New Price Floor: The market established that price levels above $3,000 per ounce could be sustained, resetting expectations for gold's valuation in the current economic climate.
- The Power of Investment Demand: The quarter demonstrated that when institutional and retail investors return to gold en masse via ETFs, it can create powerful price momentum that overrides other factors.
- The Enduring Role of Gold: In a landscape of trade uncertainty and global instability, gold reaffirmed its primary role as the ultimate store of value and a critical component for portfolio protection.
Beginner's Quick-Reference Glossary
Basic Terms To Consider While Reading Gold Charts
Trend
- What it means: The general direction prices are moving
- Examples: Uptrend (prices making higher highs), Downtrend (prices making lower lows)
Support
- What it means: Price level where buying typically comes in
- Think of it as: A floor that catches falling prices
Resistance
- What it means: Price level where selling typically occurs
- Think of it as: A ceiling that stops rising prices
Chart Patterns
Double Bottom
- What it means: A "W" shaped pattern showing two price dips
- Signals: Often indicates the end of a downtrend
Head and Shoulders
- What it means: Three peaks, with the middle one highest
- Signals: Often suggests a trend reversal
Technical Indicators
Golden Cross
- What it means: Short-term average crosses above long-term average
- Signals: Often indicates start of uptrend
- Example: 50-day moving average crossing above 200-day
Death Cross
- What it means: Short-term average crosses below long-term average
- Signals: Often indicates start of downtrend
- Example: 50-day moving average crossing below 200-day
RSI (Relative Strength Index)
- What it means: Measures if price is moving too far, too fast
- Readings: Above 70 (potentially too high), Below 30 (potentially too low)
MACD (Moving Average Convergence Divergence)
- What it means: Shows relationship between two moving averages
- Uses: Helps identify momentum and trend changes
Volume Terms
Volume Spike
- What it means: Sudden large increase in trading activity
- Significance: Often signals important price moves
Distribution
- What it means: Pattern of selling by large investors
- Think of it as: Smart money gradually exiting positions
Accumulation
- What it means: Pattern of buying by large investors
- Think of it as: Smart money gradually building positions
Trading Terms
Breakout
- What it means: Price moving above resistance or below support
- Significance: Often signals start of new trend
Pullback
- What it means: Short-term move against the main trend
- Think of it as: A brief rest during a longer trend
Consolidation
- What it means: Price moving sideways in a range
- Think of it as: A pause that refreshes
Simple Steps for Beginners

Starting Your Chart Reading Journey
- First Week
- Learn to identify trends
- Practice finding support/resistance
- Watch how price moves in relation to moving averages
- Second Week
- Start noting volume patterns
- Learn basic chart patterns
- Practice identifying pullbacks
- Third Week
- Introduction to RSI
- Learn about trend lines
- Start combining multiple indicators
- Fourth Week
- Begin pattern recognition
- Practice entry/exit point identification
- Start paper trading
Extended Key Takeaways
- Chart patterns reflect mass psychology
- Volume confirms price action
- Multiple time frame analysis is crucial
- Risk management trumps pattern accuracy
- Context matters more than individual signals
Professional Tips and Insights
What the Pros Do Differently
- Focus on risk before reward
- Wait for pattern completion
- Consider multiple scenarios
- Track success rates
- Journal their observations
Advanced FAQ Section
Q: How do you handle false breakouts in gold charts? A: We use volume confirmation and wait for price action to confirm the move. As legendary trader Jesse Livermore said, "Be patient and wait for the action, not the promise."
Q: What's the best way to combine fundamental and technical analysis? A: We use fundamentals for direction and technicals for timing. Charts help us execute what fundamental analysis suggests.
Q: How do you adapt chart reading for different market conditions? A: Different market conditions require different tools. Trending markets favor momentum indicators, while ranging markets suit oscillators.
Looking Forward
The gold market continues to evolve, but the basics of chart reading remain constant. As George Soros once noted, "Market prices are always wrong in the sense that they present a biased view of the future."
We encourage you to start with the basics, practice regularly, and gradually incorporate advanced concepts. Remember, every master chart reader started as a beginner. Enjoy your gold investment journey!
May your charts be clear and your analysis sharp!
Additional Resources
Recommended Tools
- Tradingview for chart analysis
- Gold futures data sources
- Volume analysis tools
- Pattern recognition software
Further Learning
Remember: The best chart reader is a patient one who understands that mastery comes through practice and observation.