Introduction: Your Authoritative Guide to the Gold Market
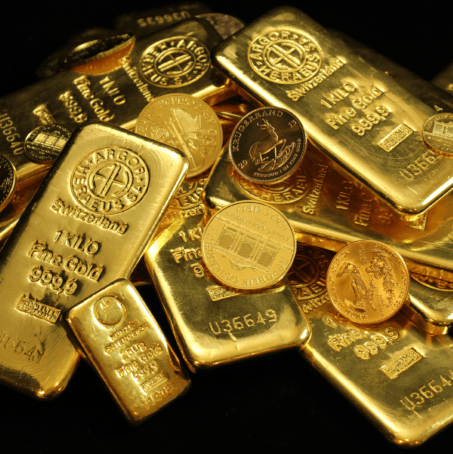
Understanding gold markets and prices in 2025 requires a clear-eyed view of the powerful forces at play, from central bank policy to global conflicts. As investors navigate a landscape shaped by the “Rio Reset” narrative and persistent economic uncertainty, gold has solidified its role as a primary safe-haven asset. It’s more than a shiny metal; it’s a complex financial instrument with a direct impact on portfolio stability.
This comprehensive guide serves as your foundational pillar page, decoding the intricate world of gold. We will explore the fundamental drivers influencing prices, demystify how to read market charts, and analyze the historical trends that provide context for today’s investment decisions, equipping you to navigate this glittering landscape with confidence.
Key Insights for Q2 2025
Current Gold Price: As of mid-June 2025, the gold spot price is hovering around $2,330 per ounce, reflecting a sustained “geopolitical risk premium.”
Federal Reserve Stance: Following its recent meeting, the Federal Reserve has signaled a continued “wait-and-see” approach, holding interest rates steady while leaving the door open for potential cuts later in the year if inflation data remains favorable.
Primary Market Drivers: Current price action is heavily influenced by ongoing conflicts in the Middle East and central bank demand, which has partially offset the headwinds from a relatively strong U.S. dollar.
Market Sentiment: Investment flows into major Gold ETFs have been moderately positive, indicating that while some profit-taking has occurred, institutional investors remain confident in gold as a long-term strategic holding.
Understanding Gold Price Fluctuations: Key Factors Influencing the Market
The first step in analyzing gold markets and prices is to understand the core factors that cause them to move. While many variables are at play, they can be distilled into a few primary categories.
Supply and Demand: The Age-Old Economic Principle
Unlike other commodities, gold’s price is less affected by annual mining supply, which is relatively stable. The key driver is demand, which comes from four main areas: jewelry, technology, central banks, and, most importantly, investment.
Economic Uncertainty: Gold as a Safe Haven
As seen throughout 2024 and into 2025, gold thrives on uncertainty. During periods of economic turmoil, stock market volatility, or recession fears, investors shift capital from “risk-on” assets to the perceived safety of gold, driving its price higher.
Inflation and Currency Devaluation
Gold is a direct hedge against inflation. When the purchasing power of currencies like the U.S. dollar falls, the price of gold tends to rise to compensate, preserving its intrinsic value.
Interest Rates: The Opportunity Cost Factor
The Federal Reserve’s monetary policy is a crucial driver. As a non-yielding asset, gold competes with interest-bearing investments like bonds. When interest rates are high, holding gold has a higher “opportunity cost.” Conversely, when rates are low, gold becomes more attractive.
How to Read Gold Price Charts: A Beginner’s Guide
 For more information about reading gold charts: Click Here
Now that we’ve covered what influences gold markets and prices, let’s talk about how to make sense of those squiggly lines on gold price charts. Understanding charts is the key to visualizing market sentiment and identifying trends.
Types of Gold Price Charts
1. 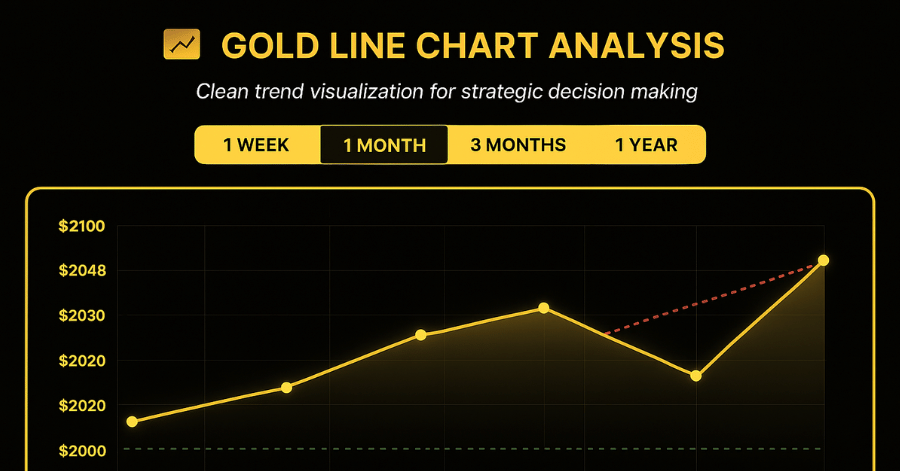 Line Charts: The simplest form, showing closing prices over time.
2. Bar Charts: Displays open, high, low, and close prices for each period.
3. 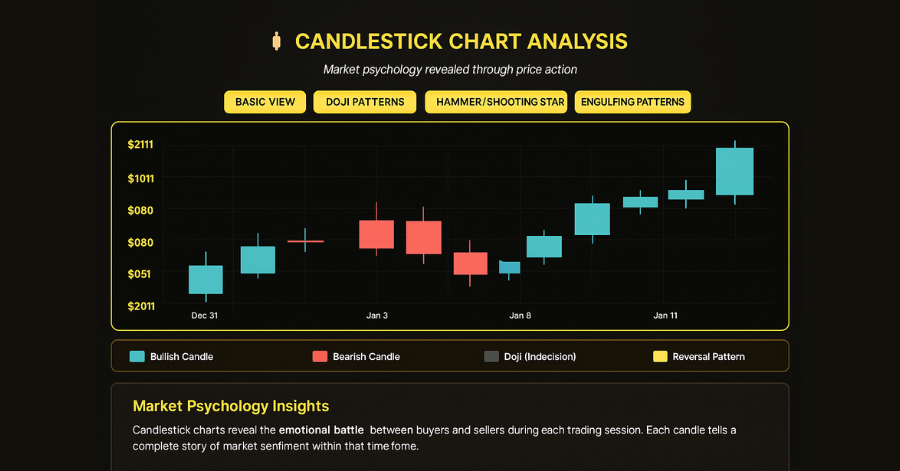 Candlestick Charts: Similar to bar charts but with added visual cues.
Key Elements to Look For
- Trend Lines: Connecting highs or lows to identify overall direction.
- Support and Resistance Levels: Price points where gold tends to bounce or struggle.
- Moving Averages: Smoothed-out price lines that help identify trends.
Reading Time Frames
Remember, different time frames tell different stories. A 1-day chart might show significant short-term volatility. A 1-year or 5-year chart reveals the dominant long-term trends shaping gold markets and prices.
Historical Context for Today’s Gold Markets and Prices
History provides an invaluable perspective on gold’s role as a financial asset. Major historical events have consistently demonstrated their safe-haven appeal.
- The End of the Gold Standard (1971): When the U.S. officially decoupled the dollar from gold, it allowed gold’s price to float freely, transforming it from a monetary anchor to a globally traded investment asset.
- The 1980 Price Spike: High inflation and geopolitical tensions in the late 1970s drove gold to a then-record high, cementing its reputation as a hedge against both economic and political instability.
- The 2008 Financial Crisis & 2020 Pandemic: Both events triggered massive flights to safety, pushing gold to new all-time highs as the global financial system faced unprecedented stress. These events are crucial reference points for understanding gold’s modern role.
Conclusion: Navigating the Golden Landscape with Clarity
The dynamics of gold markets and prices are complex, woven from the threads of monetary policy, economic data, human psychology, and geopolitical events. However, by understanding these core drivers, the seemingly chaotic movements of the market become clear.
For the modern investor, gold is not just a relic of the past but a strategic asset for the future. Recognizing its role as a hedge against inflation, a haven in times of crisis, and a counterbalance to fiat currencies provides the foundation for making intelligent and confident investment decisions.
Frequently Asked Questions (FAQ)
Q: What is the difference between the spot price and the futures price? A: The spot price is the current market price for immediate (“on the spot”) delivery of gold. The futures price is the price agreed upon today for the delivery of gold at a specific date in the future, reflecting market expectations.
Q: Is there a “best” time of year to buy gold? A: While some analysts point to “gold price seasonality” (often weaker prices in the summer, stronger in the fall and winter), these patterns are easily overridden by major economic or geopolitical events. It’s generally not a reliable strategy for long-term investors.
Q: How does the stock market affect gold? A: Gold often has an inverse relationship with the stock market. During stock market downturns, investors frequently sell equities and buy gold, and vice-versa. This makes gold a key tool for portfolio diversification.