
 For more information about reading gold charts: Click Here
Gold Volume Analysis: Gold’s Most Important Indicator
Gold Volume Analysis reveals the conviction behind every gold price movement. While price shows what happened, volume shows WHY it happened and whether the move has staying power. Professional traders call volume “the market’s truth serum” because it never lies.
Volume represents the total number of shares, contracts, or units traded during a specific period. It’s called the “truth serum” because it reveals the conviction behind price movements.
Key Volume Principles:
🔹 High Volume + Rising Price: Strong buying interest, healthy uptrend
🔹 High Volume + Falling Price: Strong selling pressure, potential decline
🔹 Low Volume + Price Movement: Weak conviction, potential reversal
🔹 Volume Precedes Price: Volume often spikes before major moves
Volume Categories:
• High Volume: >2.5x average (significant interest)
• Medium Volume: 0.8-2.5x average (normal activity)
• Low Volume: <0.8x average (limited interest)
Remember: Price shows you WHAT is happening, but volume shows you HOW MUCH conviction is behind the move.
Volume patterns reveal market psychology and help confirm or question price movements. Here are the most important patterns:
✅ Healthy Uptrend Pattern:
• Volume increases on up days
• Volume decreases on pullbacks
• Each new high comes with volume expansion
• Shows accumulation by institutions
⚠️ Warning Patterns:
• Volume decreases as price rises (divergence)
• High volume on small price moves (resistance)
• Volume spikes with little price change (distribution)
📊 Volume Confirmation Rules:
1. Breakouts: Must be accompanied by 2x+ average volume
2. Reversals: Look for volume spikes at support/resistance
3. Trends: Volume should expand in trend direction
4. Pullbacks: Should occur on declining volume
Pro Tip: When price and volume agree, the move is likely to continue. When they disagree, prepare for potential reversal!
🏦 Accumulation Phase:
This is when “smart money” (institutions, funds) quietly buy large positions:
Characteristics:
• Price moves sideways or slightly higher
• Volume gradually increases
• Price holds above key support levels
• Volume on up days > volume on down days
• Creates a “floor” under the price
📤 Distribution Phase:
This is when smart money sells their positions to retail investors:
Characteristics:
• Price may still rise but with effort
• Volume increases but price gains diminish
• More volume on down days than up days
• Price fails to make significant new highs
• Creates a “ceiling” above the price
🎯 Trading the Phases:
• Buy during accumulation: Low risk, high reward potential
• Sell during distribution: Take profits before the crowd realizes
• Avoid dead zones: Between phases, markets often go nowhere
Key Insight: Follow the smart money! They accumulate before moves and distribute before declines.
🚀 Volume Spikes (3x+ Average) Signal:
• Major news or events
• Institutional entry/exit
• Emotional climax points
• Potential trend changes
📈 Buying Climax:
• Massive volume with large price gain
• Often marks short-term top
• Exhaustion of buying power
• Usually followed by pullback or consolidation
📉 Selling Climax:
• Huge volume with sharp price drop
• Panic selling exhaustion
• Often marks important bottom
• Sets up potential bounce or reversal
🔄 Volume-Price Relationships:
• Price ↑ + Volume ↑: Healthy trend continuation
• Price ↑ + Volume ↓: Trend weakening, caution
• Price ↓ + Volume ↑: Strong selling, trend may continue
• Price ↓ + Volume ↓: Selling exhaustion, potential support
⚡ Advanced Techniques:
• **Volume Rate of Change:** Compare current vs historical averages
• **Volume by Price:** Identify where most trading occurred
• **Volume Oscillators:** Smooth volume data for trend analysis
Master Tip: Volume spikes at key support/resistance levels are the highest probability trade setups!
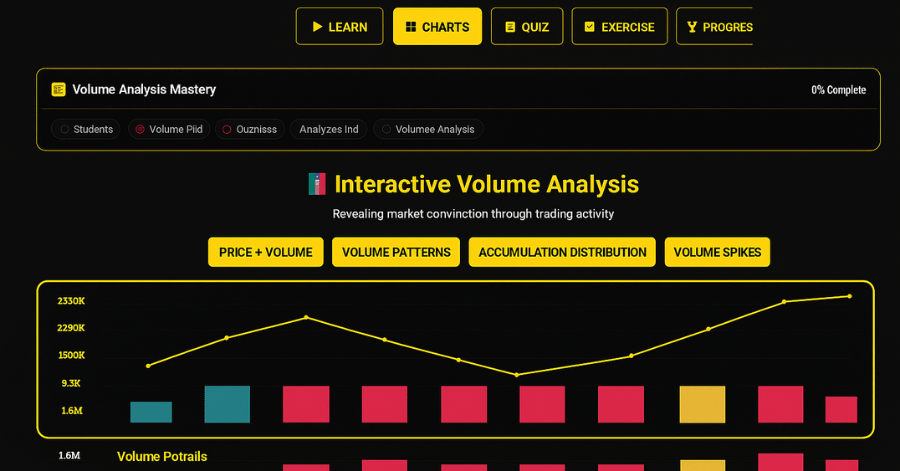
📊 Interactive Volume Analysis
Revealing market conviction through trading activity
Next Steps:
Master all volume concepts, achieve 85% on the quiz, and complete 3 volume analysis exercises to unlock the Volume Analyst badge!
Critical Gold Volume Analysis Patterns
Rising Price + Rising Volume = Healthy Demand
What it means: Genuine buying interest supporting price advance
Psychology: Both retail and institutional money flowing into gold
Trading signal: Trend likely to continue
Action: Look for pullback entry opportunities
Rising Price + Falling Volume = Weak Advance
What it means: Price rising without conviction
Psychology: Fewer participants supporting the move
Trading signal: Potential trend exhaustion
Action: Prepare for reversal or consolidation
Falling Price + High Volume = Strong Selling
What it means: Heavy institutional selling pressure
Psychology: Smart money distributing positions
Trading signal: Trend likely to continue down
Action: Avoid catching falling knives
Interactive Analysis Features
Volume Spike Detection: Automatic unusual activity alerts ✅
Accumulation/Distribution: Smart money tracking ✅
Price-Volume Correlation: Strength measurement ✅
Market Phase Identification: Cycle position analysis
Decoding Smart Money Activity
Accumulation Phase Signals
Steady buying volume on price dips
Lower volume during price advances
Support levels holding with volume
Price stability despite selling attempts
Distribution Phase Warnings
High volume at resistance levels
Volume spikes on minor price declines
Decreasing volume on bounces
Price struggling to make new highs
Gold Volume Analysis-Based Trading Strategies
Strategy 1: Volume Breakout Confirmation
1. Identify key resistance level
2. Wait for price breakout above resistance
3. Confirm with volume 2x daily average
4. Enter position on pullback to old resistance
5. Set stop below breakout level
Strategy 2: Volume Divergence Trading
1. Watch for price making new highs
2. Check if volume confirms the move
3. If volume declining, prepare for reversal
4. Enter short on break of uptrend line
5. Target previous support levels
Strategy 3: Accumulation Zone Buying
1. Identify sideways price movement
2. Look for increasing volume on dips
3. Decreasing volume on bounces
4. Buy when price breaks above accumulation zone
5. Target measured move equal to zone width
Gold Volume Secrets Revealed
Time-of-Day Volume Patterns
Asian Session: Lower volume, range-bound trading
London Open: Volume spike as European markets join
NY Session: Highest volume during overlap hours
After Hours: Thin volume can create false signals
Seasonal Volume Insights
January: High volume as funds rebalance
Wedding Season (India): Cultural demand increases
Year-End: Institutional positioning affects volume
Crisis Periods: Volume spikes during uncertainty
Professional Volume Analysis
Institutional Activity Indicators
Block trades: Large volume spikes without major price moves
Dark pool activity: Volume increasing without visible orders
Cross-trading: High volume at day’s high/low prices
Retail Activity Patterns
News-driven spikes: High volume after announcements
Momentum buying: Volume increases as price rises
Panic selling: Extreme volume during sharp declines
Gold Volume Analysis-Price Relationship Mastery
Confirmation Signals
New highs with expanding volume
Breakouts with 3x average volume
Support holds with declining volume
Pullbacks on below-average volume
Warning Signals
New highs with declining volume
Breakouts with low volume
Support tests with increasing volume
Rallies are dying on high volume
Using This Gold Volume Analysis Dashboard
1. Start with Pattern Recognition: Identify current market phase
2. Analyze Volume Spikes: Understand what triggered unusual activity
3.Track Smart Money: Follow accumulation/distribution signals
4. Confirm Price Moves: Never trade breakouts without volume confirmation
The interactive dashboard above shows real-time volume analysis across multiple timeframes. Watch how volume patterns reveal the true story behind gold’s price movements.