
 For more information about reading gold charts: Click Here
Why Technical Indicators Dominate Gold Analysis
Gold Technical Indicators transform raw gold price data into actionable trading signals. In fact, professional traders rely on these mathematical formulas to time entries, exits, and identify trend changes before they become obvious to the market.
Technical indicators are mathematical calculations based on price, volume, or other market data that help traders make informed decisions. They reveal hidden patterns and trends that aren’t immediately visible from price action alone.
Key Categories:
🔹 Trend Indicators: Show market direction (Moving Averages)
🔹 Momentum Indicators: Measure speed of price changes (RSI, MACD)
🔹 Volatility Indicators: Show price fluctuation levels (Bollinger Bands)
🔹 Volume Indicators: Analyze trading activity patterns
Why Use Indicators?
They help confirm trends, identify potential reversals, time entries and exits, and provide objective analysis rather than emotional decisions.
Moving averages smooth out price data to identify trends clearly. They’re called “moving” because they constantly recalculate as new data comes in.
📈 50-Day Moving Average:
• Shows intermediate-term trend
• Good for swing trading decisions
• Price above = bullish sentiment
• Price below = bearish sentiment
📉 200-Day Moving Average:
• Shows long-term trend
• Major support/resistance level
• Institutional investors watch this closely
✨ Golden Cross:
When the 50-day MA crosses above the 200-day MA, it’s called a “Golden Cross” – one of the most powerful bullish signals in technical analysis!
📊 RSI (Relative Strength Index):
• Ranges from 0 to 100
• Above 70 = Potentially overbought (sell signal)
• Below 30 = Potentially oversold (buy signal)
• 50 = Neutral momentum
• Look for divergences with price
⚡ MACD (Moving Average Convergence Divergence):
• Shows relationship between two moving averages
• MACD line above signal line = Bullish momentum
• MACD line below signal line = Bearish momentum
• Histogram shows strength of momentum
• Great for timing entries and exits
Pro Tip: Use RSI to identify when momentum is extreme, and MACD to confirm the direction and timing of moves.
🎯 Bollinger Bands:
• Upper band = Price + (2 x Standard Deviation)
• Lower band = Price – (2 x Standard Deviation)
• Middle band = 20-period Moving Average
How to Use Bollinger Bands:
🔸 Band Squeeze: When bands narrow, expect volatility explosion
🔸 Band Touch: Price touching bands may signal reversal
🔸 Band Walk: In strong trends, price can “walk” along a band
🎯 Multi-Indicator Confluence:
The most powerful signals occur when multiple indicators align:
• RSI oversold + MACD bullish crossover + Price at Bollinger lower band = Strong buy signal
• Golden cross + RSI in healthy range + Price breaking Bollinger upper band = Continuation signal
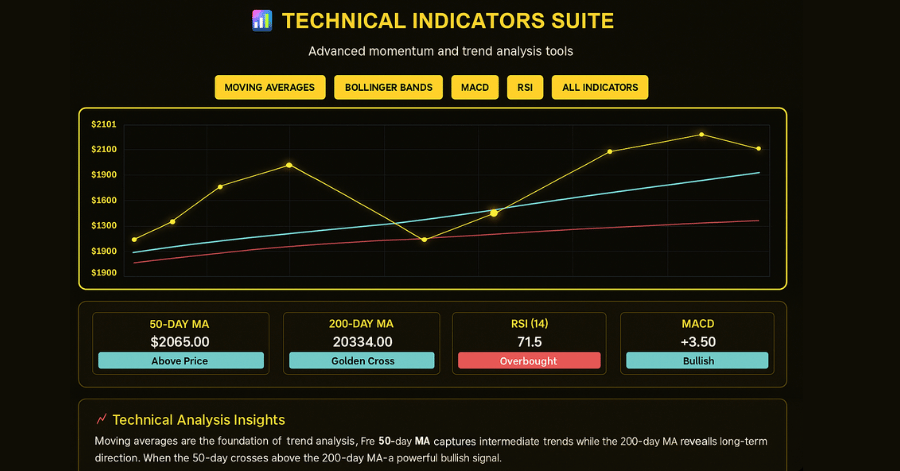
📊 Interactive Technical Analysis
Explore indicators and their signals
Next Steps:
Master all tutorial concepts, achieve 85% on the quiz, and complete 3 technical analysis exercises to unlock the Technical Analyst badge!
Gold Technical Indicators: Essential Gold Trading Indicators
Moving Averages – The Trend Foundation
50-Day Moving Average: Intermediate trend direction
200-Day Moving Average: Long-term trend health
Golden Cross: 50-day crosses above 200-day (bullish signal)
Death Cross: 50-day crosses below 200-day (bearish warning)
MACD – Momentum Detective
Signal Line Crossover: Buy/sell signal generation –
Histogram: Momentum strength measurement –
Divergence: Early trend change warnings –
Zero Line: Trend confirmation tool
RSI – Overbought/Oversold Meter
Above 70: Potential overbought condition –
Below 30: Possible oversold opportunity –
50 Centerline: Trend strength confirmation –
Hidden Divergences: Advanced reversal signals
Interactive Dashboard Features
Real-time Signals: Live buy/sell indicators
Multi-indicator Confluence: Combined signal strength
Historical Performance: Backtested success rates
Alert System: Automated signal notifications
Professional Trading Strategies
Strategy 1: Moving Average Confluence
1. Wait for price above both 50-day and 200-day MA
2. Look for pullbacks to 50-day MA support
3. Enter long positions with volume confirmation
4. Exit when price closes below 50-day MA
Strategy 2: RSI Divergence Detection
1. Identify price making new highs/lows
2. Check if RSI confirms the move
3. Trade divergences with tight stops
4. Target previous swing levels
Strategy 3: MACD Signal Line Strategy
1. Wait for MACD to cross above signal line
2. Confirm with increasing histogram bars
3. Enter on pullback to previous resistance
4. Exit when MACD crosses below signal line
Gold-Specific Indicator Insights
Market Hours Impact: For instance, indicators behave differently during Asian vs. NY sessions
News Event Filters: RSI often gives false signals during economic announcements
Seasonal Patterns: Moving averages more reliable during gold’s seasonal strength periods
Gold Technical Indicators: Advanced Indicator Combinations
High Probability Setup
Price above 200-day MA (trend confirmation)
RSI between 40-60 (not overbought/oversold)
MACD histogram expanding (momentum building)
Volume above 20-day average (institutional interest)
Risk Management Rules
Never trade single indicator signals
Wait for 2-3 indicator confluence
Use position sizing based on signal strength
Always set stops below key technical levels
Getting the Most from This Dashboard
1. Start with Moving Averages: Establish trend direction first
2. Add Momentum: Use MACD to time entries within the trend
3. Check Extremes: Use RSI to avoid overbought/oversold conditions
4. Confirm Volume: Ensure institutional participation
Explore the interactive dashboard above to see how these indicators work together in real-time. Notice how the strongest signals occur when multiple indicators align.