
 For more information about reading gold charts: Click Here
Why Gold Candlestick Charts Analysis Rules Gold Trading
Introduction To Gold Candlestick Charts
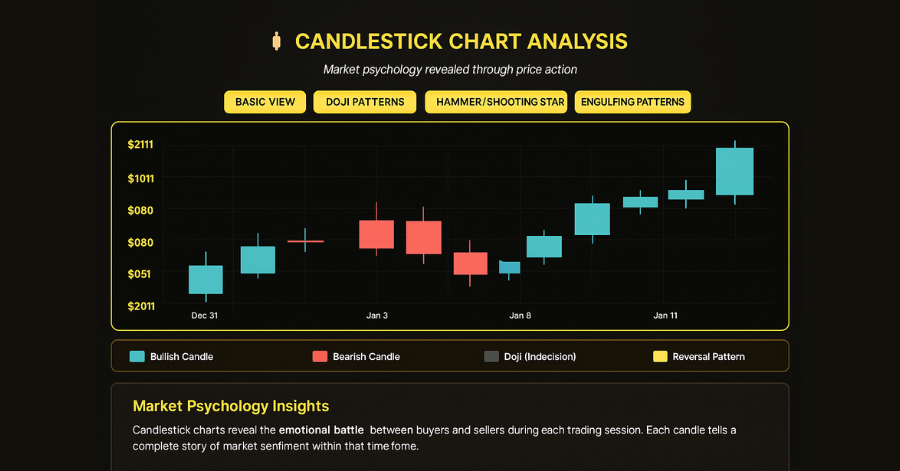
To begin with, Gold Candlestick Charts reveal the emotional battle between gold buyers and sellers during each trading session.
The Reveal
Every candle tells a complete story of market sentiment, making them essential for tactical gold trading decisions.
Candlestick charts are one of the most powerful tools in technical analysis. Each “candle” represents a complete trading period (day, hour, etc.) and shows four crucial pieces of information:
🔵 Open: The starting price when trading began
🔴 Close: The final price when trading ended
⬆️ High: The highest price reached during the period
⬇️ Low: The lowest price reached during the period
The body of the candle shows the difference between open and close, while the wicks (thin lines) show the high and low extremes.
🟢 Bullish Candles (Green/Blue):
• Close price is HIGHER than open price
• Shows buyers were in control
• Indicates upward pressure
• Often colored green or blue
🔴 Bearish Candles (Red):
• Close price is LOWER than open price
• Shows sellers were in control
• Indicates downward pressure
• Usually colored red
The longer the body, the stronger the sentiment!
🕯️ Doji Pattern:
• Open and close prices are nearly equal
• Shows market indecision
• Often signals potential reversals
🔨 Hammer Pattern:
• Small body with long lower wick
• Shows rejection of lower prices
• Bullish reversal signal
⚡ Engulfing Pattern:
• One candle completely “engulfs” the previous
• Shows strong momentum shift
• Powerful reversal signal
Every candlestick tells a story about the battle between buyers and sellers:
🧠 Long Wicks: Show extreme emotions (fear/greed) that pushed prices to extremes but couldn’t be sustained
📏 Body Size: Indicates the strength of conviction. Large bodies show strong sentiment, small bodies show uncertainty
🔄 Pattern Context: The same pattern can have different meanings depending on where it appears in a trend
Remember: Candlesticks reveal not just what happened to prices, but WHY it happened psychologically!
📈 Interactive Chart Analysis
Explore different patterns and timeframes
Next Steps:
Complete all tutorial steps, score 80% or higher on the quiz, and finish 3 exercises to unlock the Expert Trader badge!
Master These Essential Gold Candlestick Charts Patterns
Doji Patterns – Market Indecision
What it shows: Opening and closing prices nearly equal
Psychology: Bulls and bears in perfect balance
Trading signal: Potential reversal after strong trends
Gold context: Often appears at major support/resistance levels
Hammer Patterns – Reversal Signals
Formation: Long lower wick, small body at top
Psychology: Sellers pushed the price down, but buyers regained control
Trading signal: Bullish reversal at support levels
Gold application: Common at key psychological price levels ($2000, $1900)
Engulfing Patterns – Momentum Shifts
Bullish engulfing: Large green candle engulfs previous red candle
Psychology: Complete sentiment reversal
Trading signal: Strong trend continuation or reversal
Volume: Must be confirmed with above-average volume
Interactive Learning Features
Pattern Recognition: Automatic pattern detection
Psychology Insights: Understand trader emotions
Success Rates: Historical pattern performance
Volume Analysis: Confirmation indicators
Gold Candlestick Charts: Reading Gold Market Psychology
Bullish Signals
Long green bodies: Strong buying conviction
Small wicks: Limited selling pressure
Increasing volume: Institutional participation
Bearish Warnings
Long red bodies: Heavy selling pressure
Upper wicks: Rejection of higher prices
Volume spikes: Distribution activity
Bearish Warnings
Long red bodies: Heavy selling pressure
Upper wicks: Rejection of higher prices
Volume spikes: Distribution activity
Advanced Candlestick Strategies
Multiple Timeframe Analysis
– Use daily candles for trend direction
– Apply hourly candles for precise entries
– Weekly candles for portfolio allocation
Pattern Combinations
– Look for multiple patterns confirming signals
– Combine with support/resistance levels
– Wait for volume confirmation
Risk Management
– Place stops below hammer lows
– Exit positions on bearish engulfing patterns
– Use position sizing based on pattern reliability
Gold-Specific Candlestick Insights
Asian Session: Often shows range-bound candlesticks with small bodies
London/NY Overlap: Higher volatility creates longer wicks
News Events: Doji patterns are common before major economic announcements
Start exploring the interactive candlestick chart above to see how these patterns play out in real gold price action. Notice how volume often validates or invalidates pattern signals.